The Subtle but Essential Role of File Size Awareness in Front-End Debugging

Every front-end developer has faced that peculiar moment when the UI behaves oddly, yet nothing in the logic seems wrong. A component lags, a layout shifts unexpectedly, or a script refuses to load consistently across devices. After digging through console logs and reviewing logic flows, the real issue sometimes turns out to be something much simpler: the size of the files being shipped to the browser.
File size awareness is one of those quiet skills that experienced engineers develop over time. It doesn’t always get discussed openly, but it plays a surprisingly important role in solving tricky bugs and improving a team’s debugging instincts. When you understand what your users are actually downloading, certain problems begin to reveal themselves more clearly.
Why file size often hides in the background
Front-end tooling has become incredibly powerful. We bundle, transform, tree-shake, code-split, and compress without giving it much thought. These tools automate so much that it’s easy to forget how large our final output has become. A tiny import from the wrong utility library or an overlooked image asset can swell a bundle from kilobytes to megabytes.
When debugging, most developers instinctively look at logic issues first. But when an app slows down on slower networks or older devices, file size becomes a silent contributor. And not just total size — the distribution of that size across routes, shared chunks, and assets can deepen or disguise a problem.
How oversized files reveal themselves in debugging
File size issues rarely announce themselves directly. Instead, they show up as unrelated symptoms. For example, when an interactive widget feels sluggish, it’s easy to blame the component logic. But if the bundle delivering that component grew unexpectedly due to a large dependency, the device simply may not be parsing and compiling it quickly enough.
Another common scenario appears when your app behaves differently in development versus production. During development, files are uncompressed and caching behaves differently, so you don’t always notice the true cost. In production builds, however, a single misconfigured asset pipeline can balloon your script sizes, and you suddenly start seeing slow initial loads or timeouts in real-world conditions.
Where tools and observability meet intuition
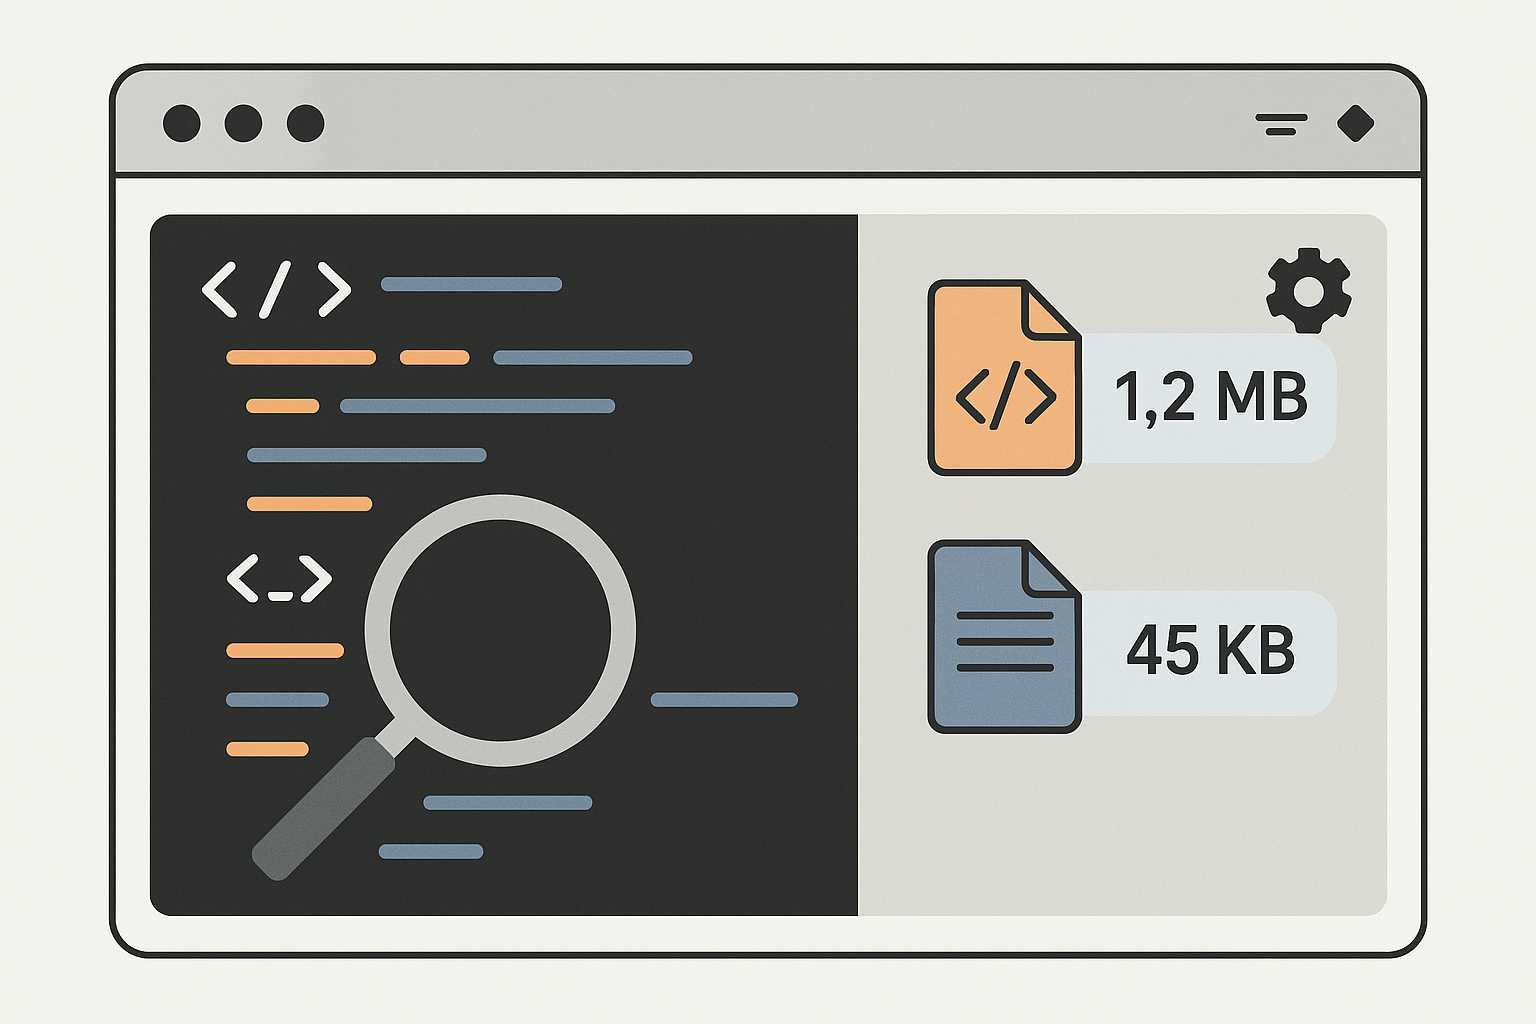
Over time, developers develop a sense for when something “feels too heavy.” That intuition comes from paying attention to bundle reports, network waterfall views, and browser devtools. Even casually checking the output of a CSS minifier like this one during a debugging session can reveal unused styling or overly large style blocks that weren’t obvious in the source.
While debugging, some developers rely on network throttling inside DevTools. This isn’t to simulate poor connections arbitrarily, but to observe how the app behaves when resources take longer to load. Slow-loading assets can expose race conditions, brittle initialization logic, or layout shifts that only happen when critical files load later than expected.
The connection between file size and responsive behavior
Certain UI bugs only appear on low-end devices, and file size is often the hidden cause. Mobile processors take longer to parse and execute large JavaScript bundles. If your initialization logic depends on synchronous execution, large bundles can delay DOM updates, leading to broken animations, delayed event listeners, or flickering states.
I once debugged a carousel that worked perfectly on a development machine but froze intermittently on a budget Android phone. We combed through timing logic, event handlers, and state transitions. The real culprit? A massive shared chunk that had quietly accumulated due to a misplaced import. Once the chunk was reduced, the carousel ran smoothly again, no logic changes required.
When debugging becomes detective work
Front-end debugging is rarely linear. It’s a web of observations, experiments, and small discoveries. File size awareness adds another dimension to this process — a lens through which unexpected behavior begins to make sense.
It can even explain odd caching behavior. Imagine updating a feature, deploying it, and hearing from users that the UI still looks broken. Sometimes, the reason is that the updated files are so large that they weren’t invalidated or delivered cleanly by the CDN. Smaller files reduce the chance of partial loads or corrupted cache entries, making the debugging loop shorter and more reliable.
Practical habits that build file size intuition
Some habits form naturally as you debug more frequently. Glancing at network payloads after every build becomes second nature. Checking the output of bundling tools like Webpack, Vite, or Rollup helps you understand how your code transforms behind the scenes.
It’s also helpful to occasionally trace unexpected bundle growth back to a specific commit. This not only strengthens debugging skills but makes future decisions more intentional. You start to recognize which libraries carry hidden size costs and how certain coding patterns impact the generated output.
Internal documentation and shared team practices can deepen this awareness too. Teams often benefit from a quick reference to related topics, such as an article on reducing JavaScript bundle size or a walkthrough about improving CSS delivery techniques. Linking these insights into regular code reviews makes file size awareness a shared responsibility instead of a personal quirk.
A broader view of debugging
When developers first learn debugging, they focus on errors and breakpoints. As they gain experience, their attention expands beyond code to everything that affects the browser’s behavior — rendering paths, asset loading, caching layers, execution timing, and yes, file size.
Seen this way, debugging becomes less about hunting a single flaw and more about understanding the entire pipeline between writing code and a user interacting with it. In that pipeline, file size sits quietly, influencing performance, reliability, and the feel of an application.
Conclusion
File size awareness doesn’t replace other debugging skills; it strengthens them. When you start viewing your builds with the same curiosity you apply to your logic, your debugging process becomes more grounded and efficient. You not only solve issues faster but begin preventing them long before they appear on a user’s screen.


